Explore and Present Your Data
Books, articles and tutorials on making maps, charts and dashboards with JavaScript, Python, R, Tableau and others
Books
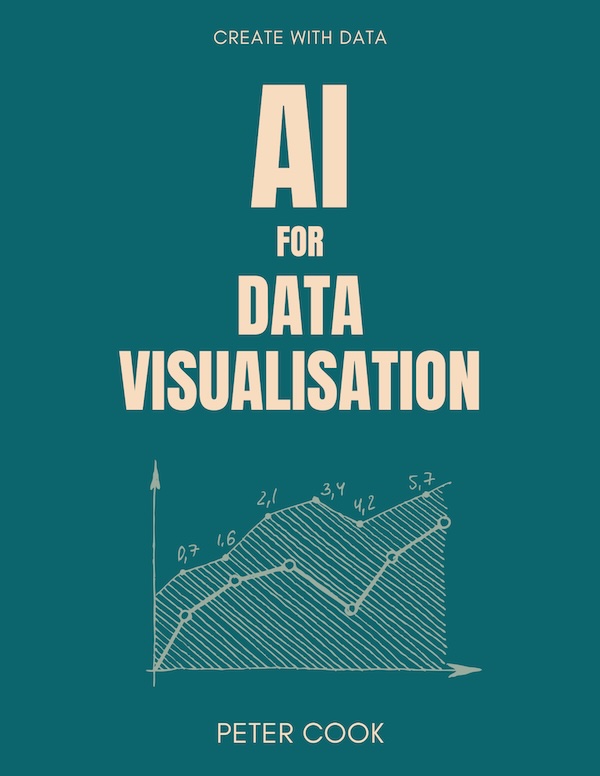
Learn how large language models like ChatGPT can transform the way you work with data.
Through real examples, you'll see how to explore datasets, clean and transform data, and create charts, maps, and dashboards — all using natural language prompts.
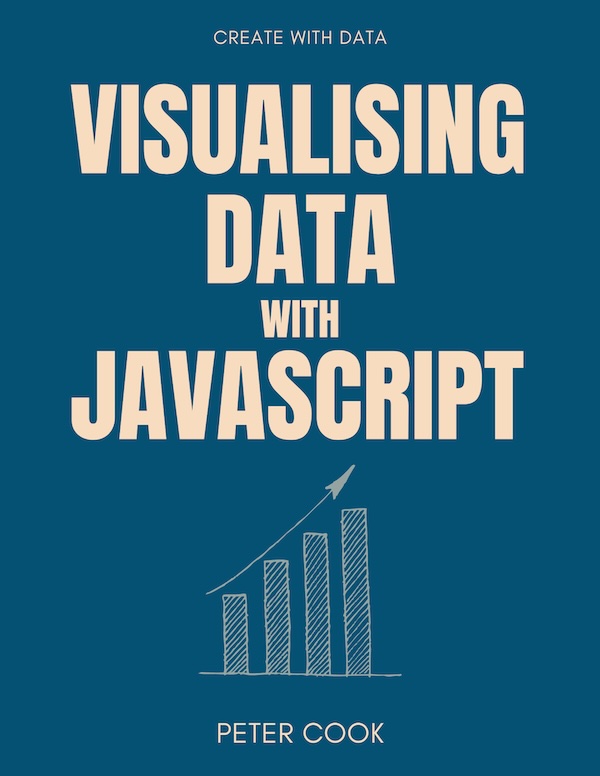
Learn how to build charts, maps and data stories using Chart.js, Leaflet and D3.js. This book gives an overview of visualising data using JavaScript.
Ideal if you're wanting to learn how to make charts and data-driven maps using JavaScript. This book also shows how to create this data story using HTML, CSS, JavaScript, Chart.js and Leaflet.
In addition this book includes a brief introduction to D3.js where you'll learn to built this custom chart.
This book includes a code download link containing eight examples.
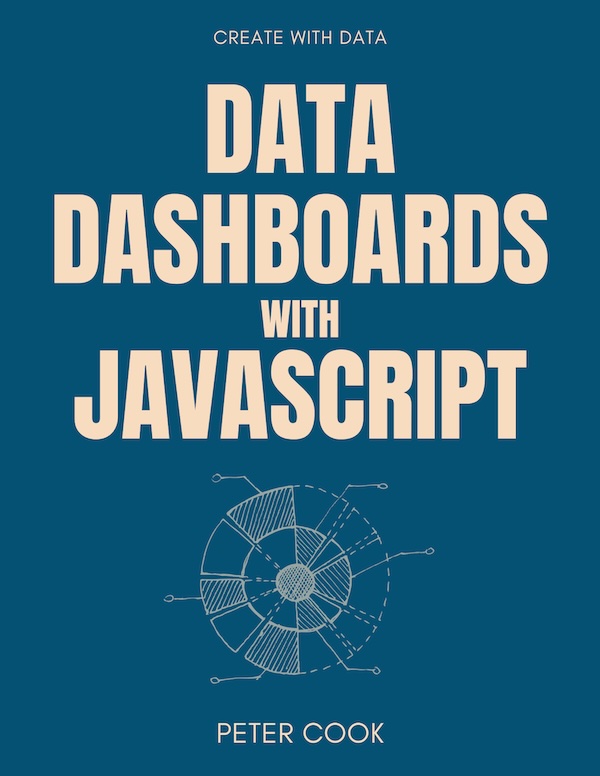
Learn how to build charts, maps and data dashboards using React, Chart.js and Leaflet.
This book shows how to create this data dashboard using HTML, CSS, JavaScript, React, Chart.js and Leaflet.
Includes an introduction to React and shows how to build chart and map components and how to combine them to create a data dashboard with filters.
This book includes a code download link containing ten examples.
"One of the best D3 books I've read. The contents are very clear, it is easy to follow and the concepts are very solid."
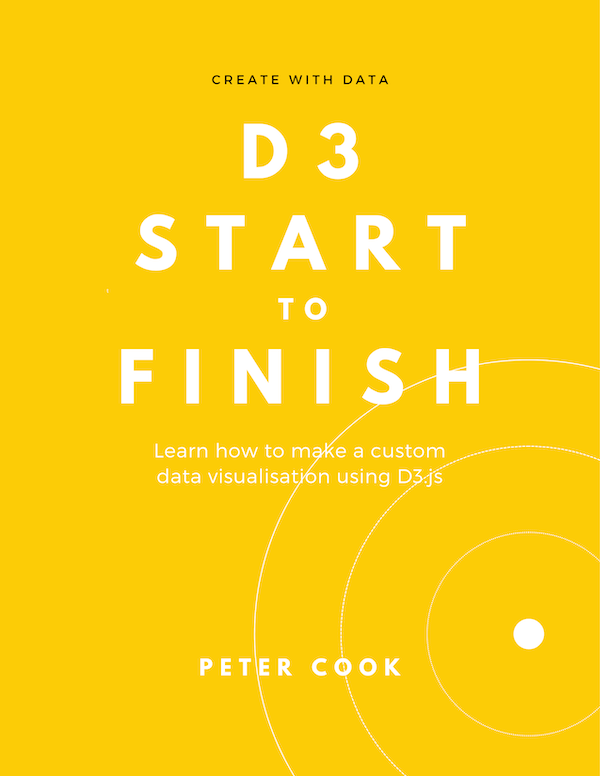
D3 Start to Finish teaches you how to build a custom, interactive and beautiful data visualisation using the JavaScript library D3.js.
The book covers D3.js concepts such as selections, joins, requests, scale functions, event handling and transitions. You'll put these concepts into practice by building a custom, interactive data visualisation.
Over 30 chapters containing clear and concise explanations and plenty of code examples.
Learn the fundamentals of HTML, SVG, CSS and JavaScript for building data visualisations on the web.
Ideal if you're wanting to learn D3.js or you use Python and/or R and wish to get started with HTML, SVG, CSS and JavaScript. Straight to the point with lots of code examples.
Covers HTML elements, SVG elements, CSS flexbox, JavaScript operators, functions, etc.
Courses
Visualising Data with JavaScript teaches you how to build charts, dashboards and data stories using Chart.js, Leaflet, D3 and React.